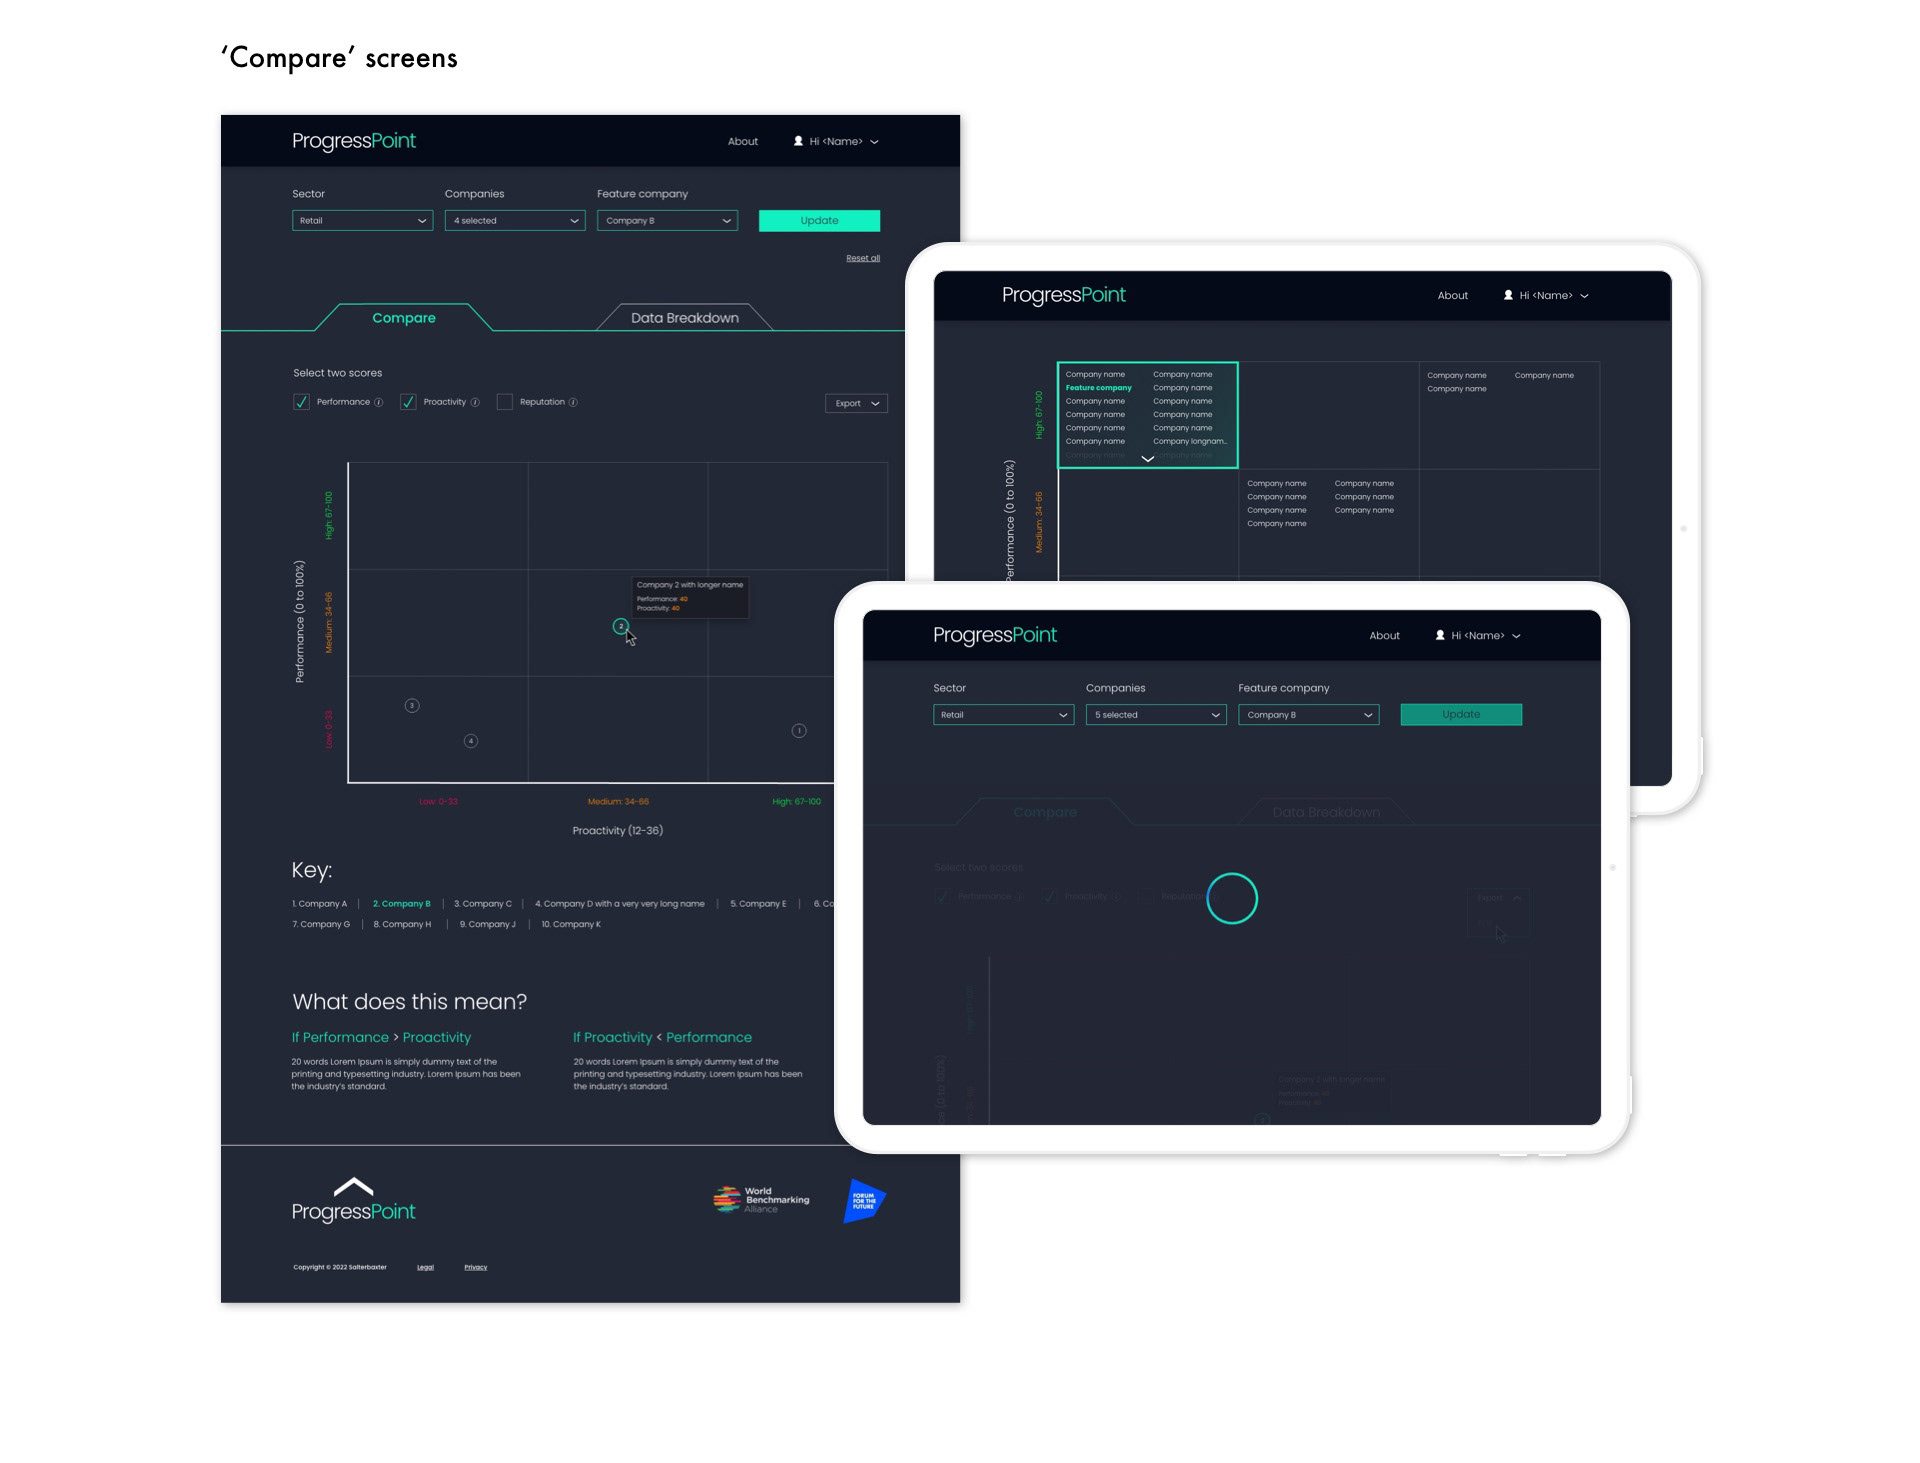
Two options for comparison screens were scoped in the UX stage. The graph with individually plotted points was preferred as this presented more accurate results for the user when plotted.
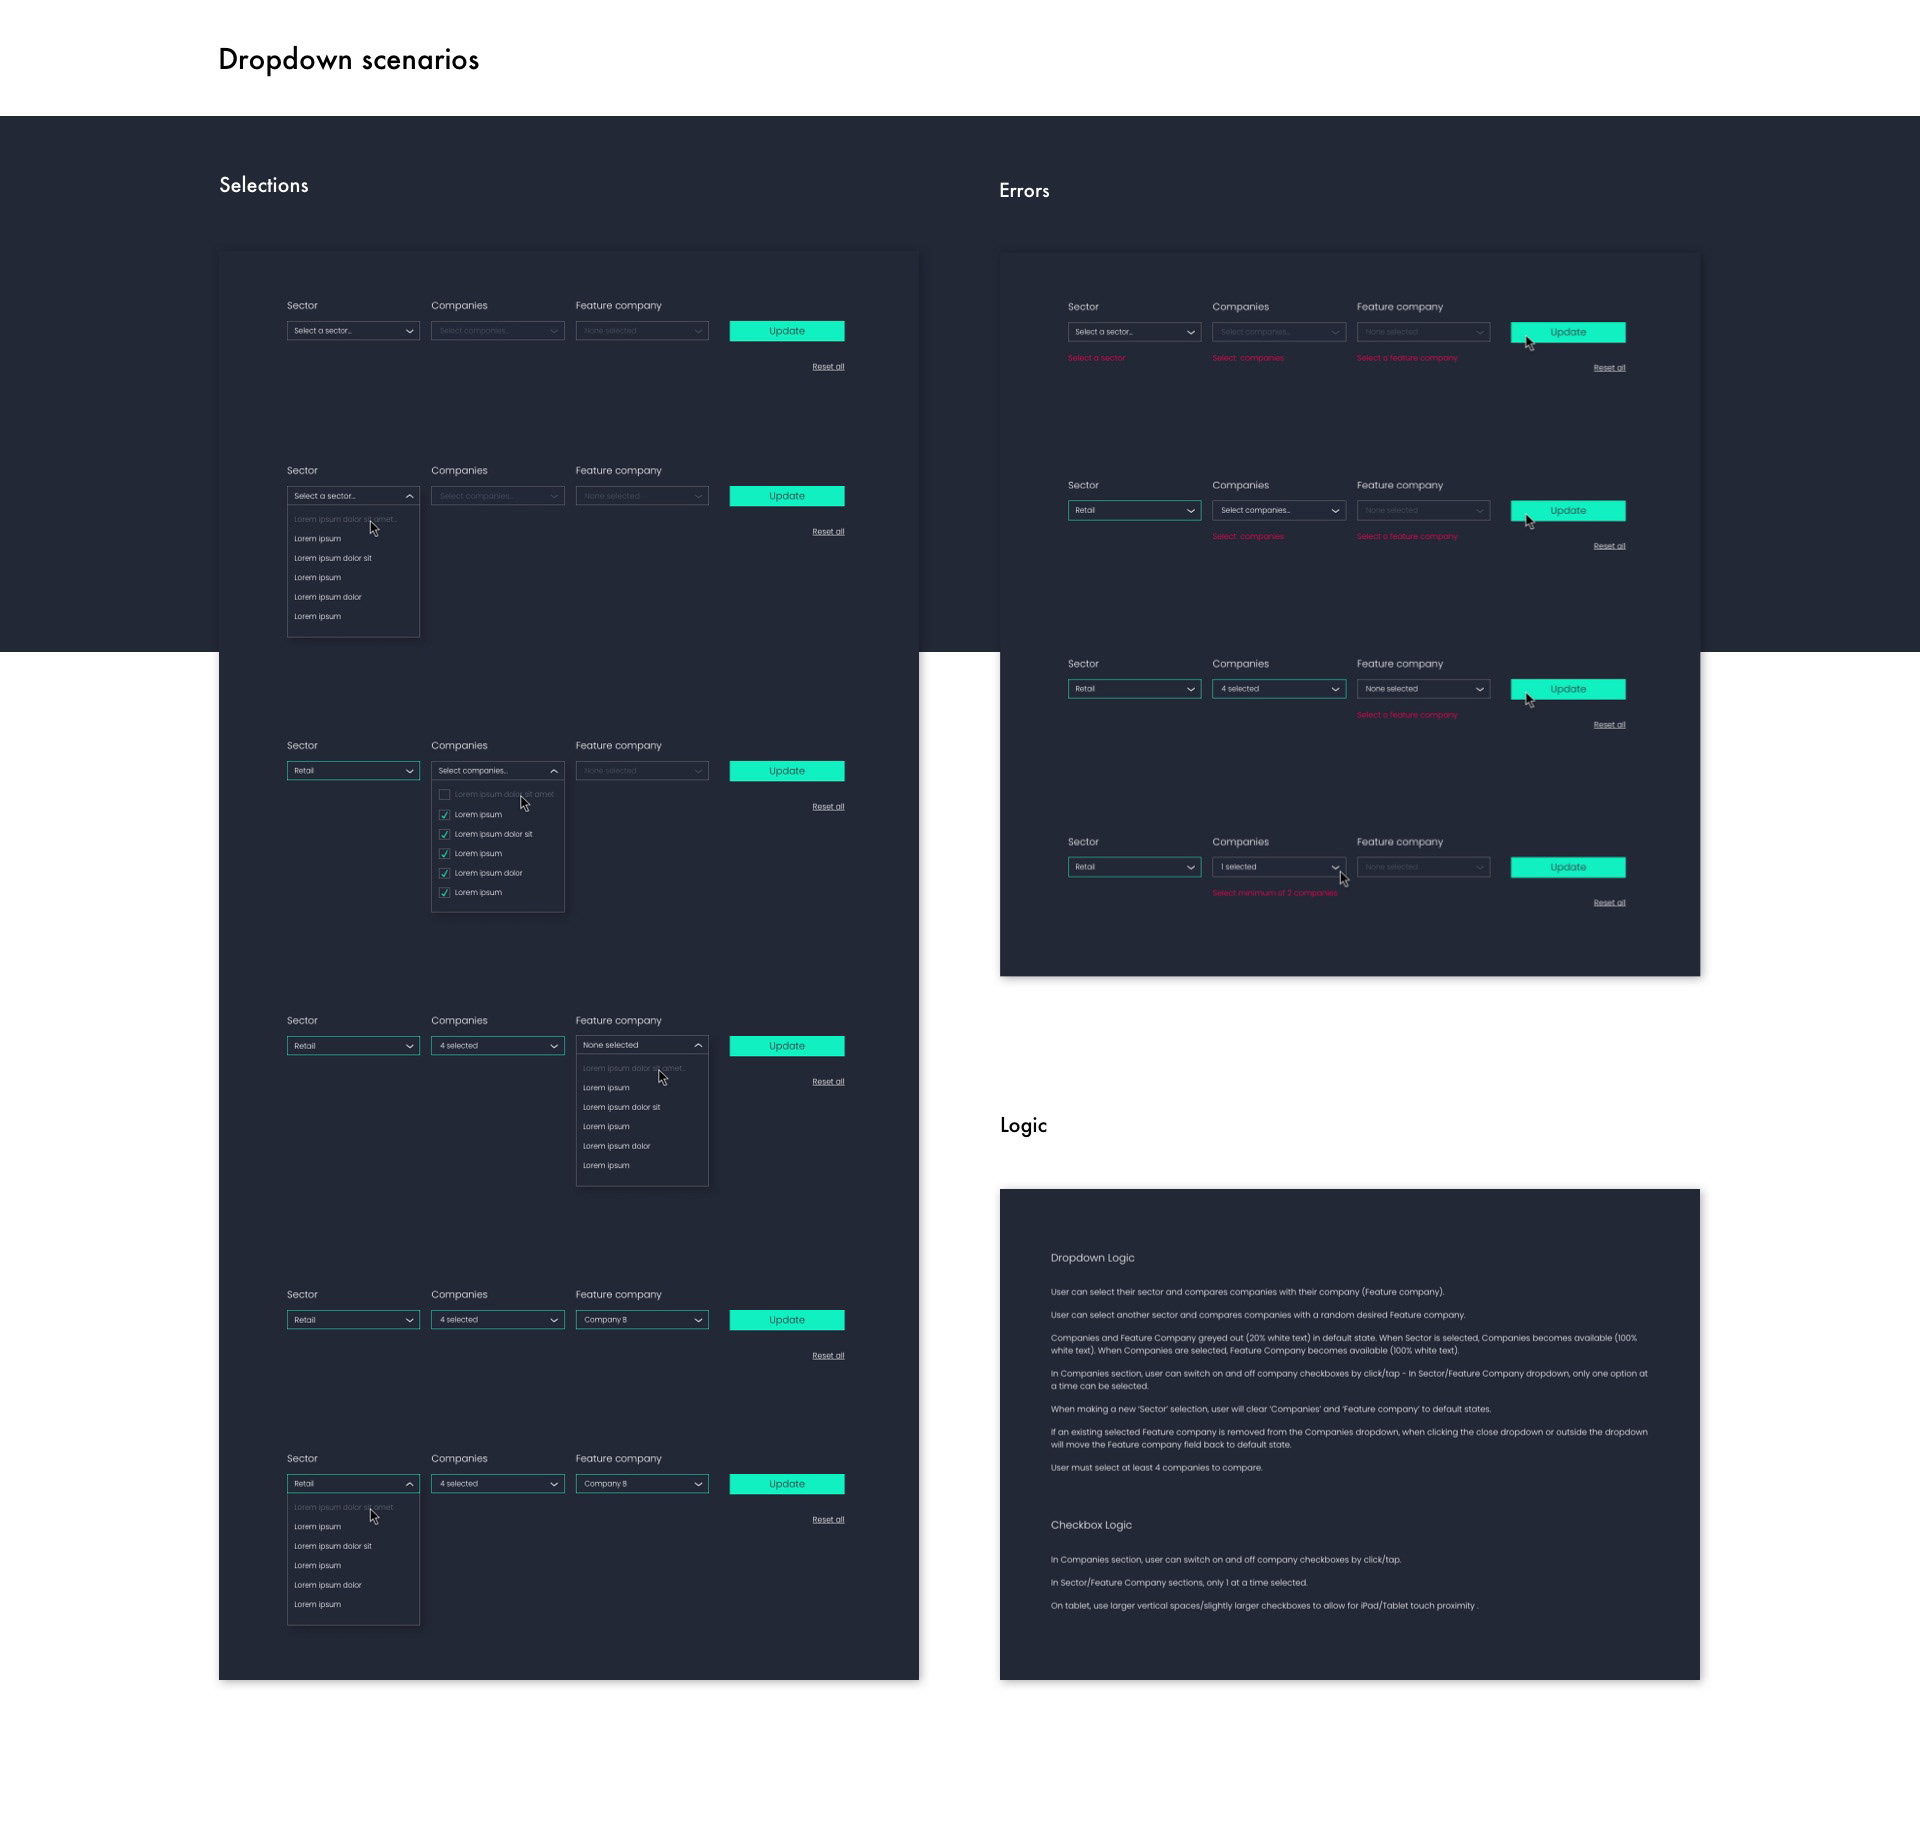
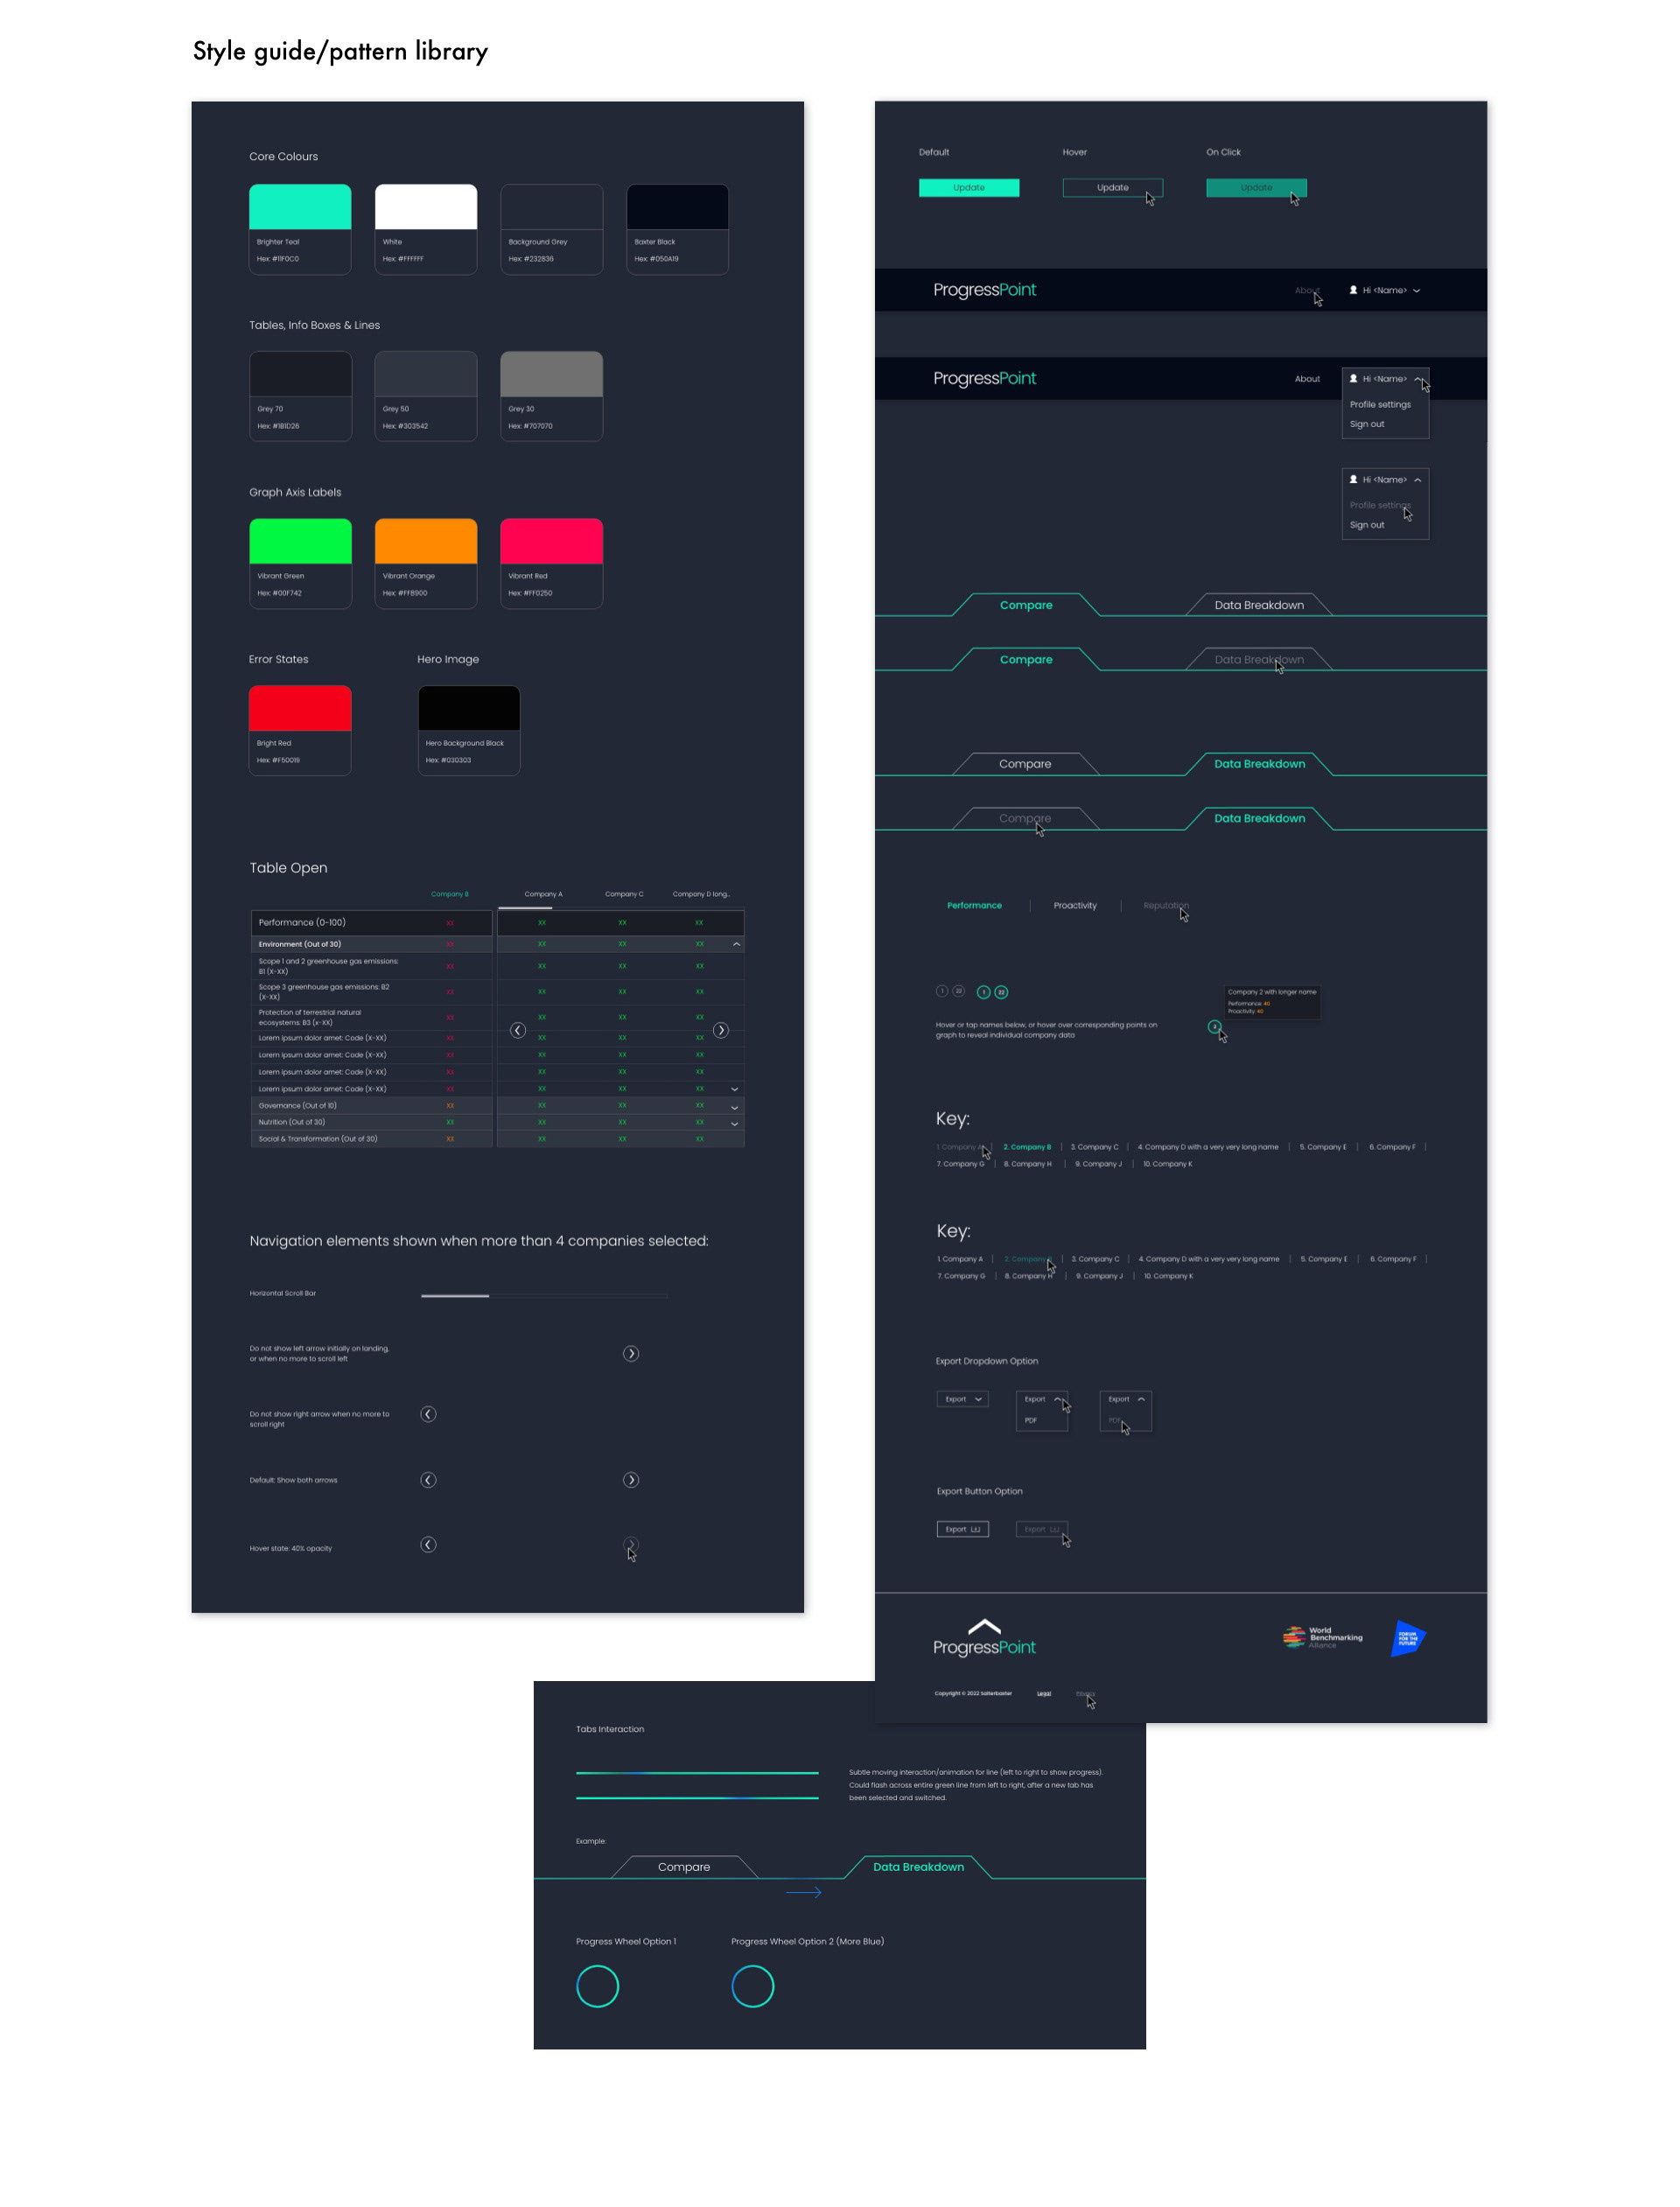
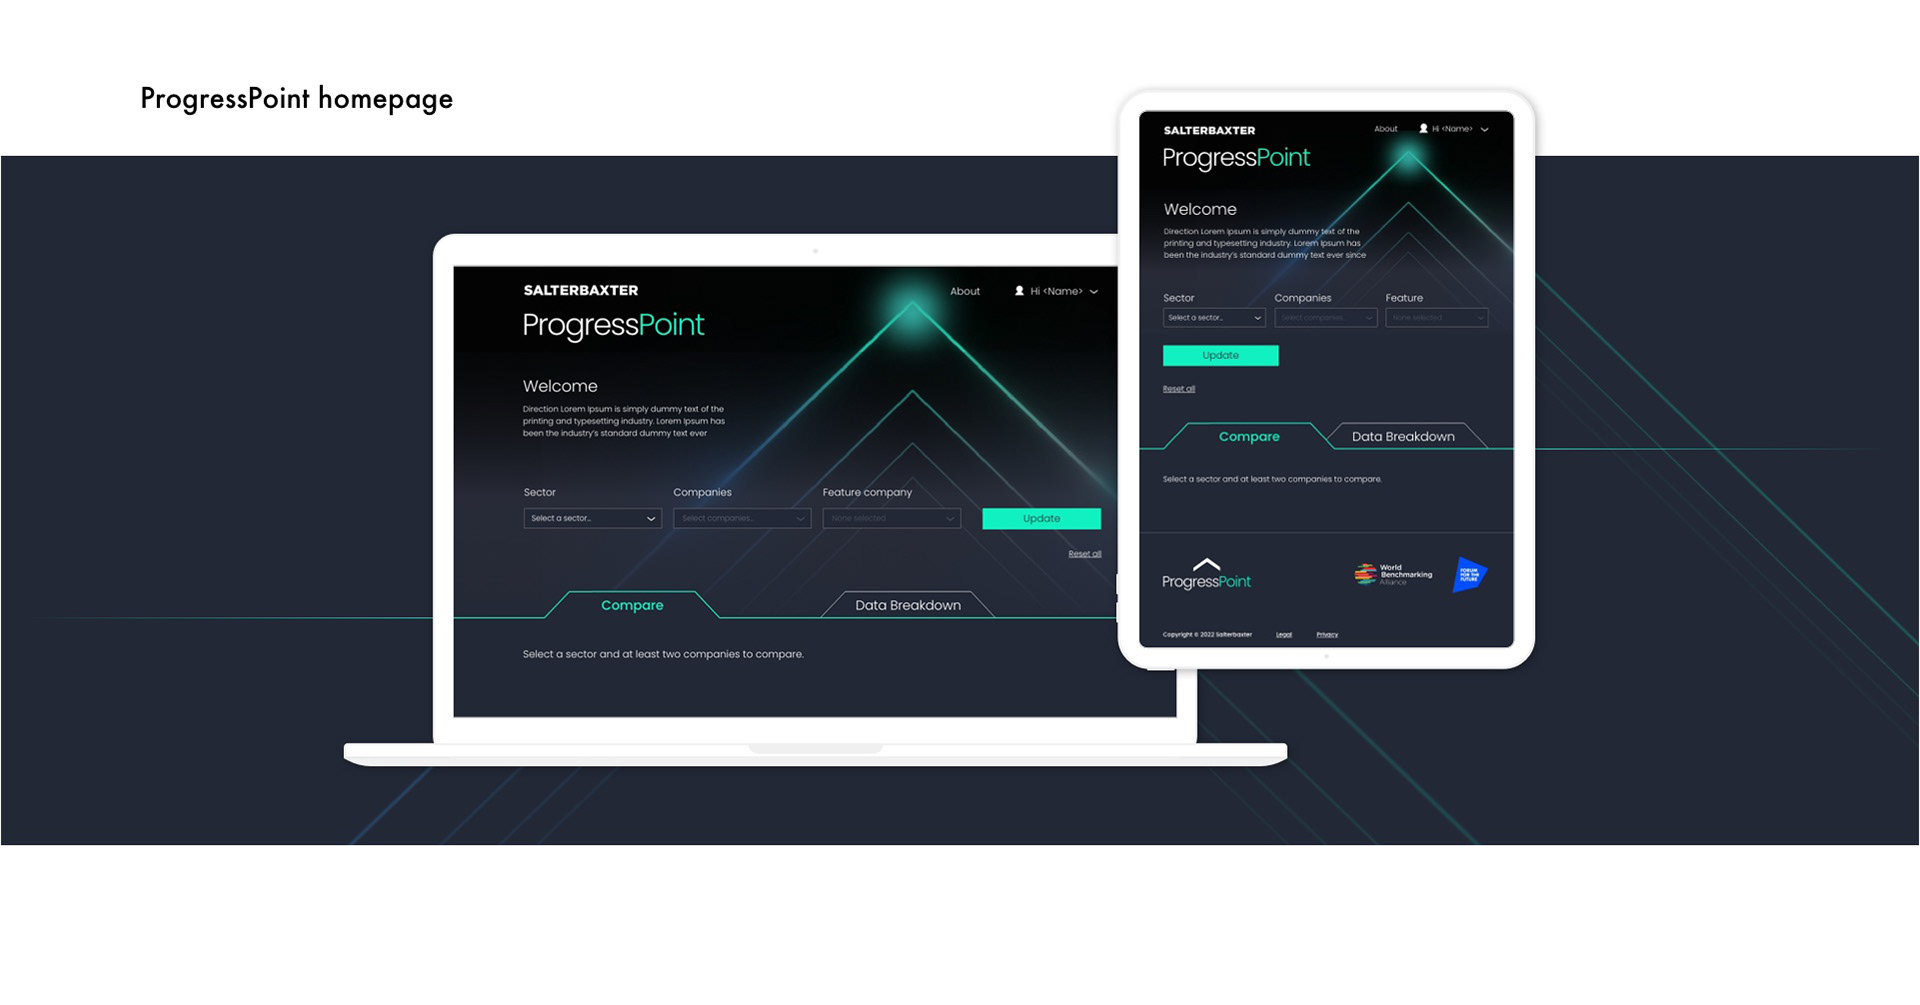
The SalterBaxter brand colour palette was used, achieving AAA contrast ratios for accessibility. All scenarios were also mapped out to prevent ambiguity for selections and error states.